17. Visualizing Loss
Outputting Training and Validation Loss Metrics
In Keras, the
model.fit()
and
model.fit_generator()
methods have a
verbose
parameter
that tells Keras to output loss metrics as the model trains. The
verbose
parameter can optionally be set to
verbose = 1
or
verbose = 2
.
Setting
model.fit(verbose = 1)
will
- output a progress bar in the terminal as the model trains.
- output the loss metric on the training set as the model trains.
- output the loss on the training and validation sets after each epoch.
With
model.fit(verbose = 2)
, Keras will only output the loss on the training set and validation set after each epoch.
Model History Object
When calling
model.fit()
or
model.fit_generator()
, Keras outputs a history object that contains the training and validation loss for each epoch. Here is an example of how you can use the history object to visualize the loss:
The following code shows how to use the
model.fit()
history object to produce the visualization.
from keras.models import Model
import matplotlib.pyplot as plt
history_object = model.fit_generator(train_generator, samples_per_epoch =
len(train_samples), validation_data =
validation_generator,
nb_val_samples = len(validation_samples),
nb_epoch=5, verbose=1)
### print the keys contained in the history object
print(history_object.history.keys())
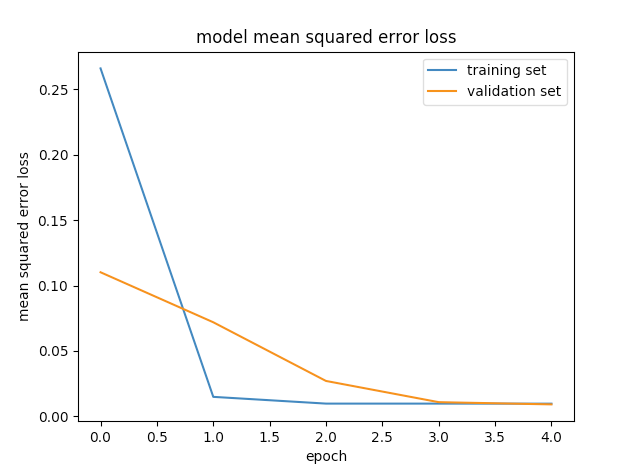
### plot the training and validation loss for each epoch
plt.plot(history_object.history['loss'])
plt.plot(history_object.history['val_loss'])
plt.title('model mean squared error loss')
plt.ylabel('mean squared error loss')
plt.xlabel('epoch')
plt.legend(['training set', 'validation set'], loc='upper right')
plt.show()